
VibroMicro Nodal Vibration Measurement of a Graphene Model
1. Project Background & Challenges
Graphene is renowned for its unique two-dimensional hexagonal lattice structure and exceptional mechanical properties (e.g., high strength, high flexibility). At the microscopic level, its vibration modes (phonon modes) determine many of its physical properties. To intuitively study wave propagation, band structures, and topological properties of such lattice structures at a macroscopic scale, researchers often construct macroscopic physical models (like the acrylic node model in this case) for simulation.
However, comprehensive dynamic testing of such models faces severe challenges:
High Number of Nodes, Low Measurement Efficiency: Manual point-by-point measurement is extremely time-consuming, and maintaining consistent excitation conditions is difficult.
Loading Effects on Lightweight Structures: The mass of traditional contact sensors (e.g., accelerometers) significantly alters the effective mass and natural frequencies of the lightweight acrylic nodes, leading to distorted measurement data.
Full-Field Vibration Visualization Requirement: Obtaining vibration amplitude and phase information for all nodes simultaneously or in rapid succession is necessary to reconstruct the vibration modes of the entire lattice.
High Spatial Resolution Requirement: The small node size (5mm diameter) requires a sufficiently small measurement laser spot and precise targeting to avoid interference signals from the node supports or other parts.
2. Solution: Non-Contact Automated Laser Scanning Vibrometry System
This research utilized the Dynatronic VibroMicro-S100 Laser Doppler Vibrometer as the core, building a high-precision, automated vibration measurement system.
System Configuration:
Core Sensing Equipment: Dynatronic VibroMicro VM-S-100 Laser Doppler Vibrometer (featuring excellent low-frequency and micro-vibration measurement capabilities).
Automated Positioning System: High-precision two-dimensional or three-dimensional motorized translation stages for automatic and precise laser point positioning.
External Excitation System: Piezoelectric shaker, mini impact hammer, or loudspeaker for applying controlled (swept-sine/single-frequency/impulse) excitation signals to a designated "source node".
Synchronization & Control Unit: A control computer running software to synchronize the excitation signal output, stage movement, and VibroMicro-S100 data acquisition.
Analysis Software: For modal analysis, waveform transfer function calculation, and data visualization.
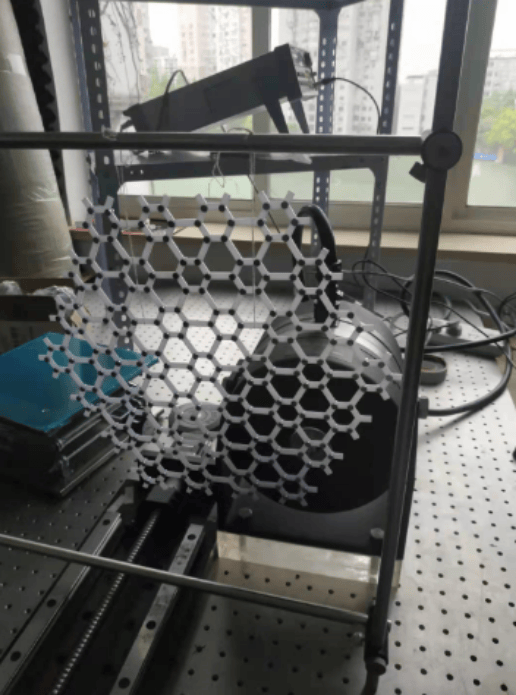
Test Object:
Macroscopic Graphene Lattice Model: Composed of acrylic circular nodes (diameter ~5mm) and lightweight connecting rods (e.g., carbon fiber rods) representing chemical bonds.
3. Test Method & Procedure
Model Preparation & Fixation: The graphene model is elastically suspended or placed on flexible supports to simulate free boundary conditions.
Measurement Planning & Programming:
Predefine the coordinates of all nodes requiring measurement in the control software based on the model's geometry.
Program the measurement sequence, e.g., "First excite Node A, then sequentially measure the response of all Nodes 1 to N".
Automated Scan Measurement:
The system automatically moves the laser point to the first source node position and applies the preset excitation.
The VibroMicro VM-S-100 measures and records the reference response at that node.
Subsequently, the system controls the translation stages to move the laser point sequentially to all other nodes, measuring and recording their vibration responses (velocity/displacement time-history curves) under the identical excitation.
This process repeats, each time using a different node as the excitation source.
4. Results & In-Depth Analysis
4.1 Wave Propagation Path Visualization
Phenomenon: By analyzing the vibration amplitude of all nodes at the same frequency when one source node is excited, a vibration energy distribution map can be generated.
Result: It clearly shows how the vibrational wave propagates through the hexagonal lattice structure, exhibiting strong propagation in certain specific directions and rapid attenuation in others.
Value: Visually verifies the anisotropic wave characteristics of the graphene lattice structure.
4.2 Mode Shape Identification and Bandgap Detection
Phenomenon: Performing modal analysis on the response of each node at different frequencies allows extraction of the overall mode shapes of the entire structure.
Result: The system successfully identified various collective vibration modes, such as in-plane shear and out-of-plane bending. Frequency response function curves revealed frequency ranges where the vibration response of all nodes was very weak – these are the structural "bandgaps".
Value: Provides direct experimental evidence for designing phononic crystals or vibration filters based on graphene-like structures.
4.3 Structural Defect Impact Assessment
Phenomenon: Intentionally remove or alter a node/rod (simulating an atomic vacancy or doping) and repeat the measurements.
Result: Comparing the vibration propagation maps and modes of the intact and defective structures clearly shows how the vibration wave is scattered or localized by the defect, or how new vibration modes localized around the defect appear.
Value: Provides a macroscopic, visual research method for studying the impact of material defects on mechanical properties.
5. Summary of Core Advantages
In this case study, the Dynatronic VibroMicro VM-S-100 demonstrated its exceptional capability as a cutting-edge research tool:
No Loading Interference: Ensured accurate capture of the true dynamic characteristics of the lightweight acrylic nodes.
High Spatial Accuracy & Resolution: The small laser spot and automated stages enabled precise targeting and measurement of densely packed nodes.
High Efficiency & Repeatability: The automated process replaced tedious manual operations, ensuring consistency and reliability for large-scale measurement data.
Rich Amplitude & Phase Information: Provided the complete data foundation for reconstructing complex mode shapes and analyzing wave propagation.
6. Commercial Application Prospects
Metamaterial R&D: For validating and optimizing the wave control performance of novel acoustic/mechanical metamaterials.
Aerospace Structures: For studying the vibration and sound transmission characteristics of lightweight lattice or honeycomb sandwich structures.
Precision Instruments & Electronics: For analyzing the modes of micro-structures like chip packages and circuit boards for vibration reduction design.
Fundamental Scientific Research: Providing an intuitive experimental platform for frontier physics concepts like topological mechanics and non-reciprocal transmission.
Conclusion:
By integrating the Dynatronic VibroMicro VM-S-100 Laser Doppler Vibrometer with an automated positioning system, researchers successfully achieved precise "visualization" studies of microscopic graphene vibration problems at a macroscopic scale. This solution not only provides a powerful experimental tool for understanding the dynamics of complex lattice structures but also significantly advances the development of a new generation of engineering materials and structures based on bio-inspired lattice designs.