
MEMS Vibration Measurement with VibroMicro VM-S-100

1. Project Background and Technical Requirements
1.1 MEMS Technology Characteristics
Micro-Electro-Mechanical Systems (MEMS) are miniature systems integrating micro-sensors, micro-actuators, signal processing, and control circuits. Their typical features include:
Micro-scale Size: Structural dimensions on the micrometer to millimeter scale.
High Resonance Frequencies: Operating frequencies typically range from kHz to MHz.
Extremely Small Vibration Amplitudes: Displacement ranges from nanometers to micrometers.
1.2 Measurement Challenges
Limitations of Traditional Methods: Contact measurements introduce loading effects, altering the dynamic characteristics of MEMS structures.
Resolution Requirements: Nanometer-level or higher displacement resolution is needed.
Frequency Response: Measurement bandwidth up to MHz levels is required.
Spatial Resolution: Micron-level laser spot positioning accuracy is necessary.
2. Test System Configuration
2.1 Core Measurement Equipment
Main Equipment: Dynatronic VibroMicro VM-S-100 Laser Doppler Vibrometer
Key Parameters:
Displacement Resolution: < 1 pm/√Hz
Frequency Range: DC ~ 20 MHz
Laser Spot Size: < 10 μm
2.2 Auxiliary Systems
Excitation System:
Piezoelectric Shaker
Electrostatic Drive Setup
Signal Generator + Power Amplifier
Positioning System:
High-Precision Micro-Positioning Stage
Microscope Vision Positioning System
Environmental Control:
Vibration-isolated Optical Table
Vacuum Chamber (Optional)
3. Test Methods and Procedures
3.1 Resonance Characteristic Testing
Objective: Obtain the frequency response characteristics of the MEMS structure.
Procedure:
System Calibration
Precisely locate measurement points using the microscope system.
Adjust the laser beam to be perpendicular to the measurement surface.
Frequency Sweep Test
Set sweep range: Determined based on the MEMS design frequency.
Sweep type: Linear or logarithmic sweep.
Sweep rate: Ensures quasi-steady-state response.
Data Acquisition
Acquire vibration velocity/displacement signals.
Record the input excitation signal as a reference.
Result Analysis
Plot the amplitude-frequency characteristic curve.
Identify resonance frequency points.
Calculate the Quality Factor (Q factor).
3.2 Modal Characteristic Testing
Objective: Obtain the complete vibration modes of the MEMS cantilever.
Procedure:
Measurement Planning
Define a grid of measurement points on the cantilever surface.
Plan the automated scanning path.
Point-by-Point Measurement
Control the positioning stage to locate each measurement point sequentially.
Perform resonance frequency tests at each point.
Record the vibration amplitude and phase at each point.
Data Synthesis
Reconstruct the vibration pattern of the cantilever.
Analyze the shapes of different vibration modes.
Calculate modal parameters (frequency, damping, mode shape).
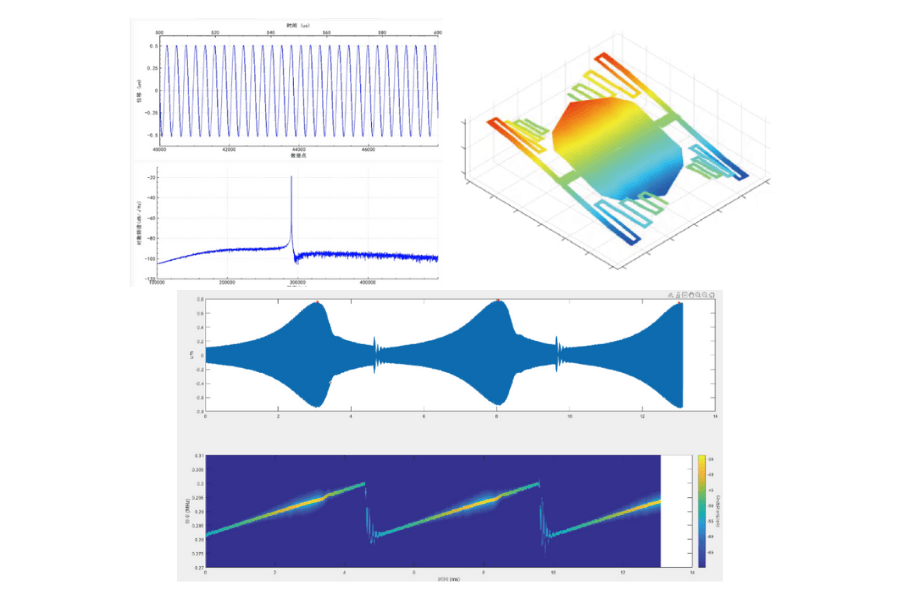
4. Key Test Results
4.1 Typical Resonance Characteristic Data
Resonant Frequency: 125.6 kHz
-3dB Bandwidth: 1.2 kHz
Quality Factor Q: ~105
Maximum Vibration Amplitude: 850 nm (@ 5V drive voltage)
4.2 Modal Analysis Results
First Bending Mode: 45.3 kHz
Second Bending Mode: 284.7 kHz
First Torsional Mode: 156.2 kHz
Mode Shapes: Clearly show node and anti-node positions for each mode.
5. Technical Advantages
5.1 Measurement Performance Advantages
Non-Interfering Measurement: Non-contact method avoids mass-loading effects.
Ultra-High Resolution: Sub-nanometer displacement resolution.
Wide Bandwidth Coverage: Fully covers the MEMS operating frequency range.
High Spatial Resolution: Micron-sized spot for accurate targeting of micro-structures.
5.2 Operational Advantages
Fast Measurement: Automated scanning improves test efficiency.
Visualized Results: Intuitive display of vibration modes.
Quantitative Analysis: Provides precise numerical results.
6. Application Value
6.1 R&D Stage
Design Verification: Validate the accuracy of simulation models.
Performance Optimization: Guide adjustments of structural parameters.
Failure Analysis: Identify structural weaknesses and resonance anomalies.
6.2 Production Stage
Quality Control: Online detection of resonance frequency consistency.
Parameter Screening: Grade devices based on vibration characteristics.
Reliability Assessment: Monitor performance changes during long-term use.
6.3 Typical Application Devices
MEMS Accelerometers
Gyroscopes
Micro-Mirror Arrays
RF MEMS Switches
Micro-Pressure Sensors
7. Implementation Case Study
Test Object: Silicon-based MEMS Micro-Mirror Array
Test Content:
Resonance frequency testing of a single micro-mirror unit.
Frequency consistency check across the array.
Modal analysis during operation.
Test Results:
Resonance Frequency Consistency: ±0.5%
Scan Angle Linearity: > 99%
Identified abnormal vibration modes, guiding design improvements.
Conclusion:
The Dynatronic VibroMicro VM-S-100 Laser Doppler Vibrometer provides a perfect vibration measurement solution for MEMS devices. Its exceptional resolution, bandwidth, and non-contact characteristics enable precise characterization of the dynamic performance of MEMS structures, providing reliable data support for R&D optimization and quality control. This technology has become an indispensable measurement tool in the MEMS field, driving micro/nano technology towards higher performance.